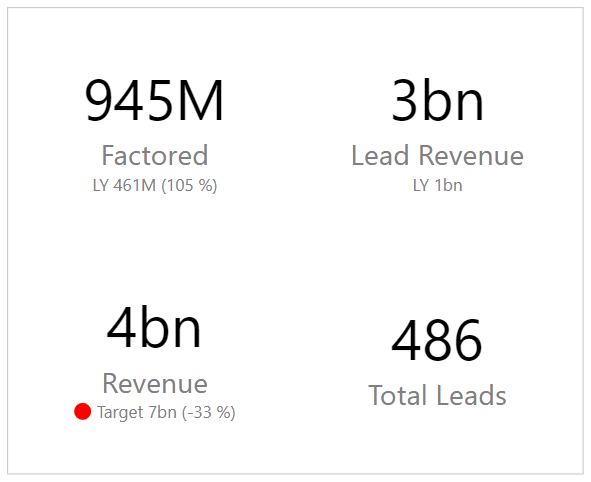
Laconic Card PRO is a more advanced version of our Laconic Card Free visual.
With the same focus on clarity and ease of use, the main extra feature of Laconic Card PRO is its ability to generate multiple cards in one visual. This delivers greatly improved report rendering performance for dashboards that have more than two cards in them at the same time reducing loads on your data source.
You will make both your users and the admins happy when using the PRO version. But hold on! There is something in it for you too. When was the last time you tried to align 15 cards vertically and horizontally? Yes, you can skip this part as well since they are auto generated and aligned perfectly every time!

You define every measure exactly how you want it displayed, just like in the free version.
Mandatory fields:
- Main Measure.
Optional fields:
- Comparison value (shown under the main measure);
- Comparison weight value (shown in brackets () next to comparison value);
- Problem Flag.
However in the PRO version you are able to add multiple Main measures and their corresponding Comparison, Comparison Weight and KPI dot values. An additional card is then generated for every new set of measures supplied to the visual.
How many cards per row?
Totally up to you! Define this by changing the Format -> Multiple Cards -> Cards Per Row setting.
Problem flag states
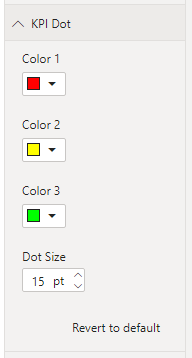
Another addition to the free version is states for problem flag. You not only have the red color dot available, but can freely choose and use up to 3 colors.
You can enable the problem flag with TRUE() function. This uses the first color (defaults to red).
Problem flag can also be shown with measure values 1, 2 or 3 which will fill the problem flag with corresponding color from the settings:

Use BLANK() measures to fill the blanks
Comparison, weight and KPI dot measures have to be added to the visual in the same order as the main measure.
If one of your cards in the middle does not have one of these values, you still need to supply a measure in order to keep the sequence. To achieve this, use measures with BLANK() function in the result. Any BLANK() value means that nothing is going to be shown in the card.
How much faster is it in real life?
A real customer test case where about a year ago we made a dashboard with 15 cards in it, all containing various measures.
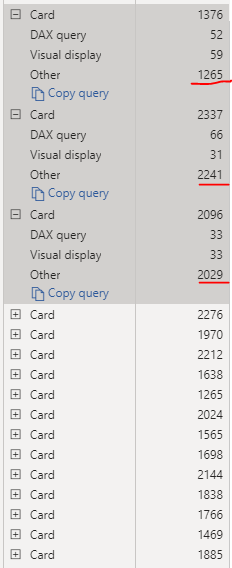
Now we were able to test the same report with Laconic Card PRO and the result surprised even us. Here is what the Performance analyzer output looks like for 15 cards in the old version of the report:

Notice that most of the time is spent on “Other” which basically means wait time. And this is consistent in all of the instances. So basically they are just waiting for the previous one to be finished before being generated.
The time to render – and subsequently wait times – are also affected by the actual performance of PBI Service. In the report logs we could see that some users had to wait up to 15 seconds before the whole report was generated.
Now here is the time for exact same measures to be displayed in one Laconic Card PRO:

The difference is huge. And the more cards you have in your report, the bigger the impact of migrating over to Laconic Card PRO will be. Now all of the report users are getting close to instant feedback which greatly improves the quality perception of the whole report package.
Remove the UNLICENSED watermark
In order for you to be able to fully test the product before buying it, all features are fully functional even when you don’t have a valid license key. The only downside to not having the license is the watermark that is constantly visible to the report users.
To remove the watermark please go to our web shop and acquire a valid license for your organization.
Type in the license key in Format->License->License Key.
You should use the same license key throughout all Laconic Charts instances within your organization.
Where to download this visual?
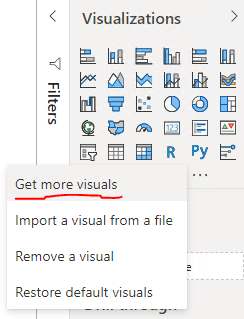
Laconic Card PRO is available for download via App Source. In Power BI Desktop, click Get More Visuals:

Search for Laconic and you will find all of our visuals.
When you import custom visuals this way, they are downloaded from AppSource. All future updates will be automatically applied to your reports. This guarantees that your reports will be functional with all future versions of Power BI without you having to worry about any updates.